What is in Season?

IMG_1708

In 1965, a folk-rock band, ‘The Byrds’, recorded their version of Pete Seeger’s song, ‘Turn, Turn, Turn’. The lyrics refer to there being a time for many activities and events, including a time to plant and a time to harvest. Although I’ve heard the song hundreds of times over the years, it had a new meaning for me when I became a supply chain manager.

Consumers want the freshest food possible, necessitating that manufacturers maintain the freshest inventory possible. This is especially true for fruits and vegetables used in processed or semi-processed foods. If these fruits and vegetables are grown in specific geographies, it can be very difficult to maintain a fresh inventory year round. Under these circumstances, purchasing the correct amount of these items is a challenge, and not having enough material to cover the requirements before the next harvest is an obvious problem. Conversely, purchasing too much material can be a problem if the shelf-life of perishable items expires before they can be utilized.

One of the biggest challenges of my career was managing the inventory of perishable materials. My colleagues and I developed a system for calculating the quantity of material to be purchased based on when new material needed to be contracted/purchased and the forecasted rate of the material’s consumption in the production of finished goods.

We determined that it worked best for the people in charge of procurement to frequently talk directly with operations people who have knowledge of the business and production planning. This not only guaranteed the freshest possible product for our customers, it reduced financial losses due to expired materials. It also minimized the need to make emergency purchases at a higher cost on the spot market to make up for shortfalls in the inventory. To facilitate these discussions, we developed a sophisticated spreadsheet tool to capture pertinent information.

Based on our experience, here are the recommended steps for developing an inventory management tool and using it to plan the best purchasing strategy for your business.

  1. Establish the parameters for product availability

List all of the items to be purchased and then answer a few simple questions about everything on the list: What is the shelf life of the material? Where is the item grown? Is it available from sources outside of your country? Is it available in the opposite hemisphere, i.e., if you are located in the northern hemisphere, can the item be grown in the southern hemisphere and shipped economically to your location? Once this information is developed, the purchasing plan can be established.

  1. Develop a consumption model

To predict the consumption of the material, a model will be required to show the projected inventory level of each item. This will require the production forecast by month, and the amount of material used in each finished good item to calculate the usage. Monthly consumption is the most convenient way to view the information. When developing the model, a ‘loss factor’ should be added to the formula to account for material wasted or damaged during storage and/or manufacturing. If the material is used in multiple finished good items, cumulative usage should be tracked and reported as a single number.

  1. Develop the inventory model

 Utilize the product availability parameters (step 1) and consumption model (step 2) to set up a tool that will show the inventory levels at the beginning or end of each month. The third variable in the inventory model should show the contracted quantities and when the material is available for usage.

Combining the inventory, consumption, and purchase quantity will generate a ‘strategic’ view of the available inventory over time. Understanding the strategic view of the inventory will indicate when to purchase the material again in the future.

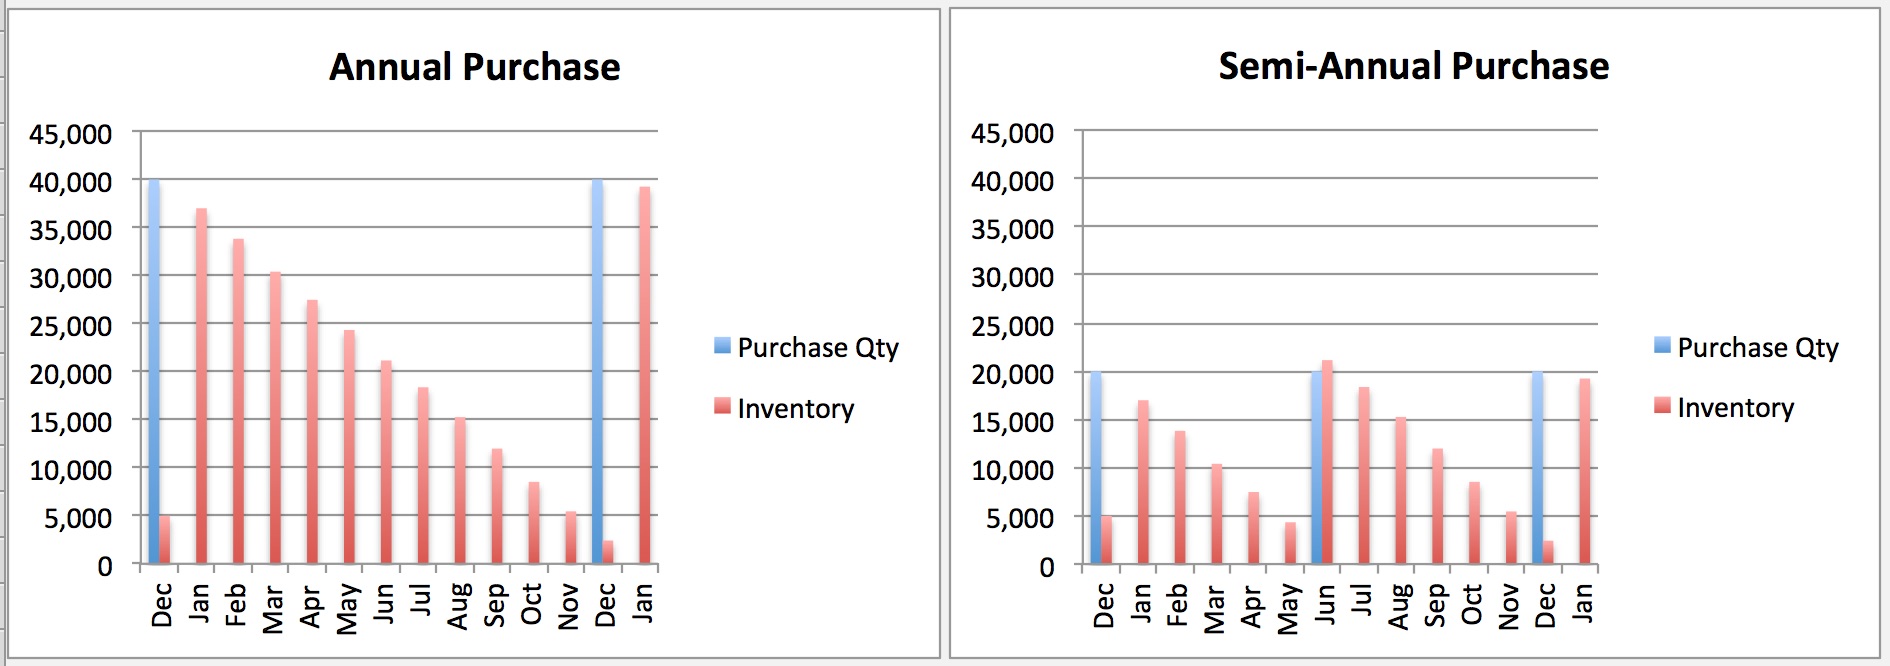
Once the inventory model is working and actual inventories are updated each month, the inventory levels can be predicted for each time period. Management can then determine if there is a risk of running out of materials or conversely, predict if there will be excess material left over that will expire before it can be used. Examples of an annual purchase and semi-annual purchase inventory model are shown below:

Final Screen Shot 2015-11-30 at 2.05.09 PM

  1. Review Inventory and Adjust Purchasing Strategy

The most important step of this process is for the appropriate parties to review the inventory positions on a monthly basis, even if the purchase date is several months away. For example, if sales are not going as planned, then a strategy can be developed to manage the potential issues of running out of material prematurely or having excess material that will expire and cannot be used. Ideally the Operations group will know how sales are trending and this intelligence can be brought to the attention of the Procurement group.

  1. Establish Timetables for Making a Purchase Decision

The process works well when a timetable is developed for each item. In general, the process is to jointly review the inventory plan and forecast 3 months prior to when the material is available for purchase. The forecast should be verified with the Production Planning/Scheduling department two months prior to contracting the item. This gives Procurement enough time to develop the quantity requirements and negotiation strategy to be executed in the month prior to the delivery on the contract.

Some companies may have ERP/MRP systems that will generate similar information for a material, however, it is important to have a tool to facilitate the discussions between Procurement and Operations. These discussions need to take place with some frequency to ensure necessary adaptations to business plans.

It may take a few months to develop and launch this entire process, but once it is running and the monthly review of inventory is taking place between Procurement and Operations, the benefits are substantial. Having a sensitive and efficient process for updating the consumption model and the inventory model is key to success. Accurate and timely information will lead to better decisions and improved business results.

It is safe to say that the Byrds were not thinking about inventory position and consumption models when they recorded one of their most famous songs, but it’s easy to hear the wisdom in their chorus:

‘There is a season – turn, turn, turn

And a time to every purpose under heaven’


Is Your Forest Too Dense? Part 3

Meteorological red white windsock in Himalaya airport,Nepal

Meaningful Metrics

Part Three

If you haven’t had a chance to read the first two parts of this series, please click here for Part One and here for Part Two.

As we continue on our path through the metaphorical forest of a busy supply chain organization, let’s look at how meaningful metrics can be an effective way to improve your company’s visibility. Most of us prefer to avoid unpleasant information. However, well-thought-out metrics will provide useful insights that can help teams improve performance, whether the news is good or bad.

To generate an accurate view of performance, there are a few basic metrics that every supply chain organization will need. The first group of metrics should be associated with Customer Service. The second set will show Inventory position and a third set will focus on Production reporting. A final consideration is for Management to openly share the metric results with the entire organization.

Customer Service

Most manufacturing organizations make products and sell them to customers, who in turn sell them to their customers. A useful customer service metric is a measurement called ‘case fill’. This is the simple percentage of how much product was delivered divided by the quantity ordered. It is also important to know if the order was fulfilled by the promised delivery date.

Although this may seem like an obvious choice for a metric, attention must be paid to the details. This metric requires clear guidelines on what is considered successful order fulfillment to allow for useful insights into issues as they arise.

Inventory

Having a visual representation of predicted inventory levels is extremely helpful. It should be based on production plans and forecasted shipments (to customers) for the length of the forecasting cycle. A ‘snapshot’ of the inventory level of multiple items can be achieved by using a spreadsheet with conditional formatting as shown below:

Mock DOH Chart 121514

Production

Being able to obtain accurate information regarding production output is a key metric. There are a few aspects of this measurement that may not be apparent: It is important to know how much was produced and the quantity scheduled to be produced. Dividing the quality made by the quantity scheduled is called schedule accuracy and most companies would consider 90% to 110% of the plan to be acceptable.

Schedule accuracy is a metric that can provide valuable insights. For example, if the quantity produced is substantially lower than planned, understanding the root cause of this will help find gaps in other systems, such as inadequate maintenance. On the other hand, if more product was made than scheduled, then resources (with time being the most valuable resource) are being spent on items not needed at that time.

It is best to focus on a small number of meaningful and accurate metrics. Having too many disparate metrics will dilute the team’s focus. Team members may spend time generating reports instead of performing root cause analysis to determine why targets are not being achieved.

One last consideration is to publically post the key metric information in a common area and on-line where all employees can see how well the organization is performing. Even if the news is not always good, it’s best to communicate the information and create a sense of transparency. Discussing what the metrics indicate can open up a healthy dialogue amongst the workforce that can lead to improved problem-solving activities.

Meaningful metrics will display both positive and negative results regarding the performance of an organization. Facing facts and addressing issues identified as a result of using a robust set of metrics will make it simpler to guide teams through the thick forest of intense pressure experienced in today’s supply chain organizations.

Photo credit: Depositphotos.com #27194263 by kaetana

Are You Painting a Clear Picture?

Woman standing in the gallery

As my department worked through a crisis several years back, I discovered that the information we needed was not available in a format that would help us resolve the issues. Due to the nature of the crisis, and the need to communicate information inside the company and to our customers, I found a way to assemble a large amount of data into a single, concise communication that made sense to everyone, not just supply chain people.

“Every now and then one paints a picture that seems to have opened a door and serves as a stepping stone to other things.” ― Pablo Picasso

I have a feeling that Picasso wasn’t thinking about customer service when he said this, but I like his sentiment. If painting ‘pictures’ can serve as stepping-stones, then they can help us move on to bigger and better things.

I was the Supply Chain manager when a production issue necessitated a massive recall for half of the existing inventory in my category. The production network was running at 100% capacity when the problem occurred so we all knew it would take time to recover. The million dollar question (literally) was how long would the situation affect our customers? A few weeks? Several months? As you might imagine, our customers were not going to accept an answer of ‘we aren’t sure when you will get your product.’ I asked my planner for a report that would show the weekly inventory position for every item for the next 13 weeks, and I was told the planning system was not able to generate such a comprehensive view.

Since a problem of this size was new for me, I asked my compatriots for examples of how to manage such a major problem. Unfortunately, I was only greeted with kind words of support. It turned out that nobody on the staff had dealt with a problem this large before and no template was available.

It was clear that we needed to develop a method for communicating the status of the inventory, and here are the steps my team and I took to ‘paint a picture’ that would generate useful information for Management and ultimately our customers.

  1. Determine what information is available from the planning system, and how to download it into a spreadsheet.
  • Weekly production plans were available in the supply planning system, however a complete view of the inventory position was not available in a single report. This was a quirk of the system, and getting individual items to aggregate into a single report was something I.T. was not willing to tackle, regardless of the circumstances.
  • We found that the individual item information could be downloaded from the planning system, however, this report included raw data showing the current inventory and planned production quantities along with other pieces of extraneous data. Using an ‘intermediate’ spreadsheet, we extracted and formatted the information needed for the next step.
  1. Once the data is in a spreadsheet, determine how to format the information to accurately tell the story
  • Within our company, most people understood the inventory position in terms of ‘days of coverage’. For the purposes of communication, we needed to put several of the items on a single page, to see the overall effect of the production plan. The most accurate way to calculate the inventory coverage was to develop a formula that used 1) the inventory available at the beginning of the week, 2) the production plan, and 3) the demand forecast, in order to calculate the theoretical days of coverage in the inventory each week going forward.
  • Once the formulae were set up to calculate days of supply for the next 13 weeks, we determined it would be helpful to color-code the information to generate a way to identify issues more easily. This is where the ‘stop-light’ formatting for each cell was used; with green being considered ‘good’ inventory levels, yellow considered ‘risky’ or potentially problematic, and red being ‘bad’ or definite customer service problems. We also used blue to indicate if the inventory was above target.
  1. Develop a view that provides information for driving decision-making.
  • Once the data was verified and the color-coding applied, we assembled a view to show the ‘days of supply’ for all items for the upcoming 13 weeks. It indicated that it would take over two months for the inventory to completely recover. (The chart below is a simulation of the initial inventory positions we discovered. It does not use the actual data.)
  • With the inventory projection view finally in place, we could discuss various production options, such as delaying the production of less popular (slower moving) items, and risking some case fill issues, while producing larger volumes of the more popular items. A few scenarios were presented to management for their review and decisions were made regarding the information to be shared with customers. Now we could show our customers when they could expect the product back on their shelves.

Mock DOH Chart 121514

Prior to developing this methodology, we were making educated guesses about the timing of the recovery. For the most part, these guesses were inaccurate, frustrating management and our customers alike. Having much more accurate and comprehensive days of supply information available was extremely helpful to the Sales team and our customers. Armed with this information customers could find ways to work around the gaps on their shelves.

At the end of the day, a clear picture of bad news was better than not knowing when customer service would recover. With a chart like the one above, we were able to have meaningful and honest discussions with our customers. Sharing accurate information, even if it is not good news, is the key to building trust between organizations.

Picasso was certainly correct about a picture serving as a stepping-stone. We found a way to move forward with our customers once we generated a clear picture of the situation.


Photo credit: depositphotos.com image:26852525 by: semisatch